Mapping the changing landscape of Solar energy
This past year has been one of devastating natural disasters, from deadly heatwaves to catastrophic wildfires and raging floods. The intensifying climate crisis was top of mind for world leaders and climate experts at the COP26 Summit that ended in a last-minute compromise to “phase down” the use of coal.
Environmental activists point to greenhouse gas emissions (GHG) as one of the main culprits in the climate crisis. Pressure is mounting in the power sector to transition from GHG emitting sources of energy like coal to more renewable sources. Solar power appears to be leading the way.
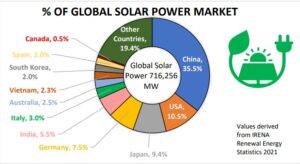
In 2020, Solar power capacity totaled 716,152 megawatts (MW), an increase of 21% compared to the year prior at 590,256 MW. Solar power, considered a clean and renewable source of energy, has the least negative impact on the environment, compared to other sources like oil, gas and coal. It does not produce GHG, nor does it pollute the water or the air.
Sunshine, available almost everywhere on earth, can generate electricity through solar power. It can be deployed nearly everywhere and translates to savings on the cost of energy and boosts the economy through local job creation.
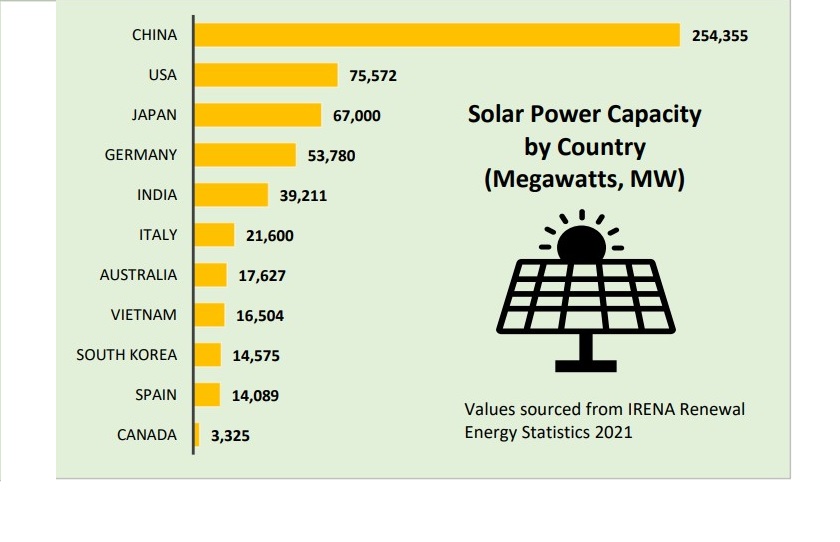
While more can be done to harvest the power from the sun, several countries around the world lead the way in adopting its viable energy. According to data from the International Renewable Energy Agency (IRENA), today, China is the leading nation with the greatest solar power capacity. (see graph above)
At the beginning of 2021, China’s installed capacity was 254,355 MW of power, that represents 35.5% of the world’s total solar power capacity. That may be an encouraging sign since the country also has the largest carbon footprint and responsible for nearly 30% of global GHG emissions.
To put things into context, one MW of solar power generates enough electricity to meet the needs of roughly 164 homes in North America. That number is dependant on variables like average amount of sunshine and household electricity consumption.
The US is the second top producer of solar power with 75,572 MW capacity. That represents 10.6% of the global solar capacity. According to the US Solar Market Insight Report (September 2021), in the first three months of 2021, the US installed 57,000 MW of solar capacity. In the first quarter of 2021, the cumulative capacity of nearly 109,000 MW was enough to power 18.9 million American homes.
Japan ranks third on the list with 67,000 MW capacity, about 9.4% of the global share. Italy is among the top European producers in solar energy at 21,600 MW, surpassed only by Germany, at 53,783 MW.
In Canada, solar power is a small share of the energy mix and represents only 0.5% of the global solar market share. At the beginning of the year, the nation had 3,325 MW of installed solar capacity but it is becoming a growing source of electricity for Canadians.
The nation’s largest solar farm project, called Travers Solar, situated in southern Alberta, will include more than one million panels covering an area the size of 1,600 football fields (about 13 km²). While the project is currently under construction, when completed, it is expected to generate more than 1,000 jobs (during peak development) and generate enough electricity to power 150,000 homes upon completion at the end of 2022.
The gaining momentum in renewable energy sources is spurred on by nations working to achieve net zero emissions and to implement measures to hold global warming to below 1.5 degrees Celsius. The support of the international community is key for adopting measures towards a clean energy transition and for phasing out the unabated use of fossil fuels.
For this reason alone, COP26’s agreement to “phase down” rather than “phase out” the use of coal would have been a disappointment to many.


